When you think of say, an audio signal or waveform, you think of this, right?
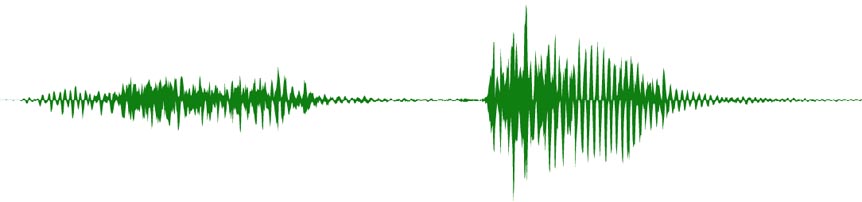
Figure 1: Audio waveform in the time domain.
Figure 1 depicts an audio signal in the time domain; essentially a visualisation of the variation of the signal’s amplitude (plotted on the y-axis) over time (plotted on the x-axis). So, by observing the signal in this way, how much information can actually be extracted[1]?